 Lekker Sun
Chapter 4 of 12
Finding the best roof area with the heatmap
Before any panels go on, the heatmap shows which parts of the roofs get the most sun, with every shadow you've drawn taken into account. For a zero-export, winter-first project like our example, it decides where the arrays go.
All chapters
The heatmap is not on every plan (the pricing page shows which plans include it), and can come with a bought project. The project has to be saved first. Without it, the card shows what it does with the button greyed out.
Make the heatmap
- Draw the roofs, the neighbours, trees and chimneys first (chapter 3). The heatmap scores the bare roof, so arrays you've already placed are ignored.
- In the Roof heatmap card on the Design tab, click Make heatmap.
- Wait up to a minute. Lekker Sun works out the sunlight on a 0.5 m grid over every main building, for every hour of a typical year, with shade from everything around it. Light from the open sky is shaded too, not just direct sun.
If the project has flat roofs, tick Include flat roofs to score them as if panels were tilted at the best angle for the site. Leave it off to keep flat roofs out of the picture.
Read the colours
The heatmap is drawn over the roofs on the map. The scale bar in the card shows what the colours mean in kWh per m²: the warmest colour is the sunniest spot, and anything below the bottom of the scale is purple.
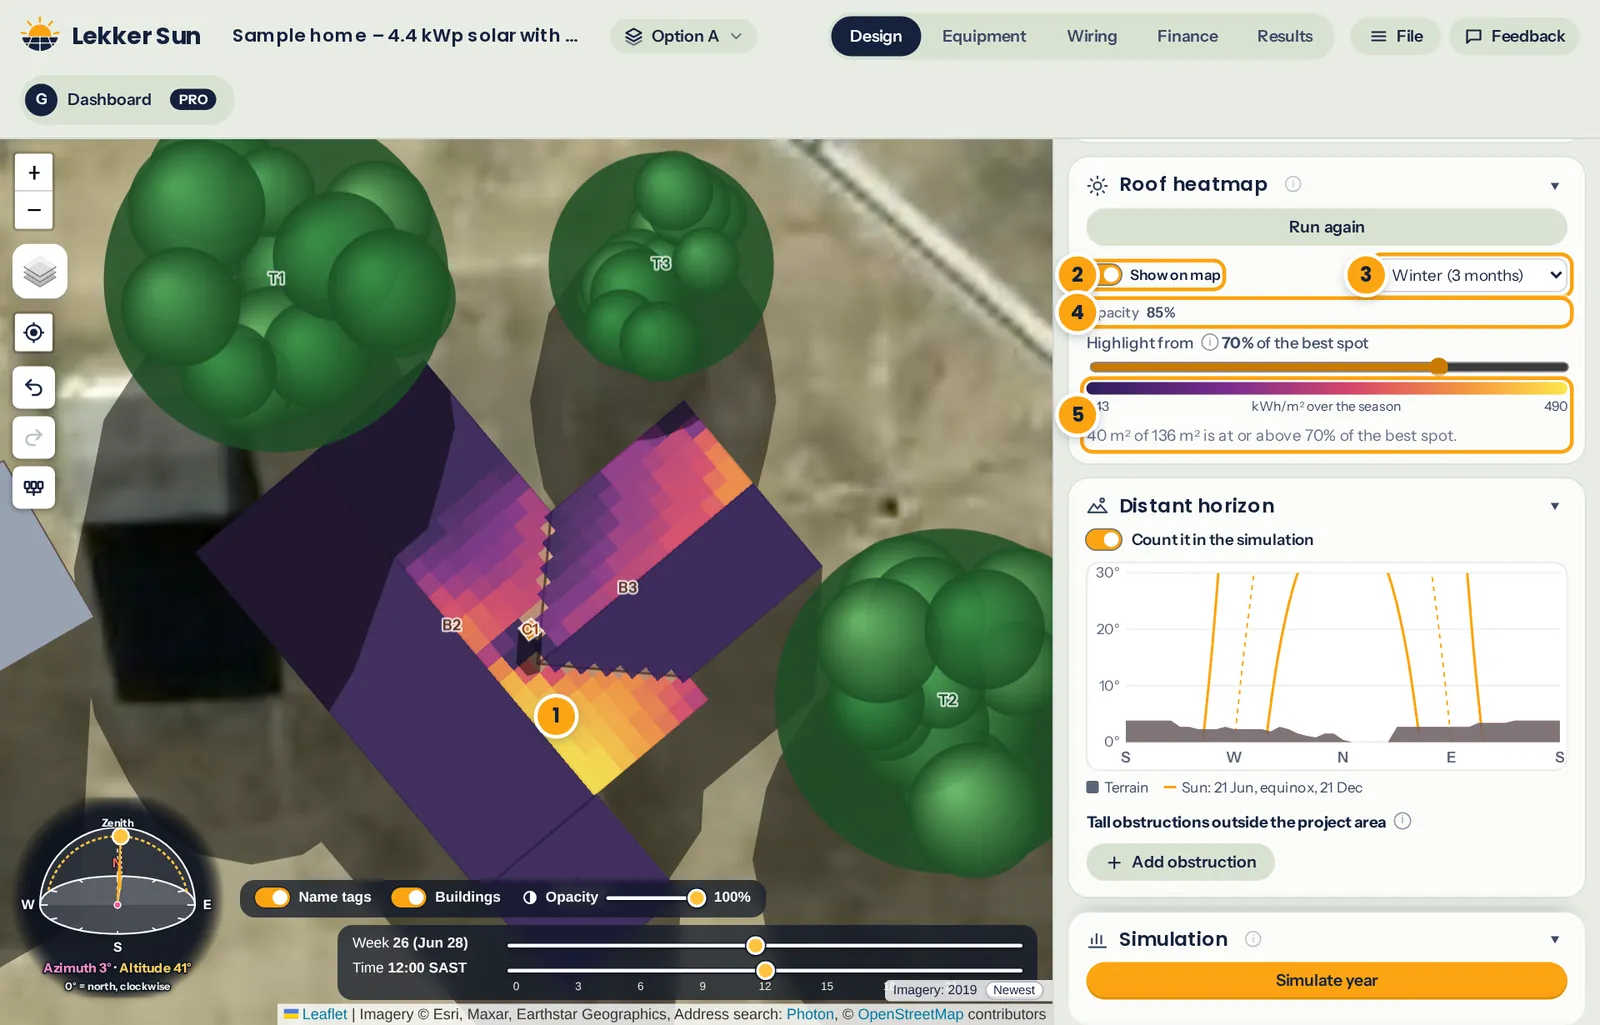
- The heatmap over the roofs. Shaded parts are cooler colours or purple.
- Show on map turns it on and off.
- Whole year, winter or summer.
- Opacity, so you can see the roof underneath.
- The colour scale and how much roof is close to the best spot.
Use the winter view for a winter-first design
Switch the season to Winter (3 months). In the southern hemisphere that's June to August. Two things usually jump out:
- South-facing slopes go cold. With the sun low in the north, a south face gets very little direct light all winter, even when it looks fine on the summer map.
- Tree and neighbour shadows reach further. A tree that never touches the roof in January can cover a corner of it every winter morning.
For our zero-export house, the panels go on the areas that stay warm on the winter map. Summer surplus can't be exported, so extra panels on summer-only areas would mostly produce energy that gets thrown away.
In our example, the slopes facing south-west and south-east go dark in winter and are ruled out. The first idea was to put one array high on the main roof's north-east slope, beside the big tree to the north-west. The winter map shows that corner going cold every afternoon. The warmest part of the whole roof is lower down the same slope, below the chimney, so the first array of four panels goes there. The second array goes on the back wing's north-west slope, the next warmest area.
That one move is worth it: with the array below the chimney instead of beside the tree, the simulation (chapter 7) gives about 16% more energy from May to August, and the house's grid import for the year halves.
Not every project is like this. With an export credit or a very large battery, the Whole year view is usually the better guide. The heatmap placement guide walks through both approaches.
Narrow it down with the colour scale
The Highlight from slider sets where purple starts, as a percentage of the best spot. At 80%, everything coloured gets at least 80% of the sunlight of the best spot on the roof, and the card tells you how many square metres that is. Slide it up to find only the very best areas, or down to see where else you could go if you need more panels.
Tip: compare the coloured area with the size of your array. One 550 W panel takes about 2.6 m². If 20 m² is above 85% in winter, that's room for about seven panels in the best spots, before allowing for gaps and roof edges.
When the heatmap goes out of date
The heatmap is saved with the project. If you move the site or change a building, tree or chimney afterwards, the card says it's out of date. Click Run again to bring it up to date. Moving or changing arrays doesn't affect it.
The report shows three heatmap pictures (whole year, winter and summer) with the sunniest spot marked, and a table of how much roof area is at or above your colour scale setting. See chapter 10.