 Lekker Sun
Using a roof sunlight heatmap to place solar panels
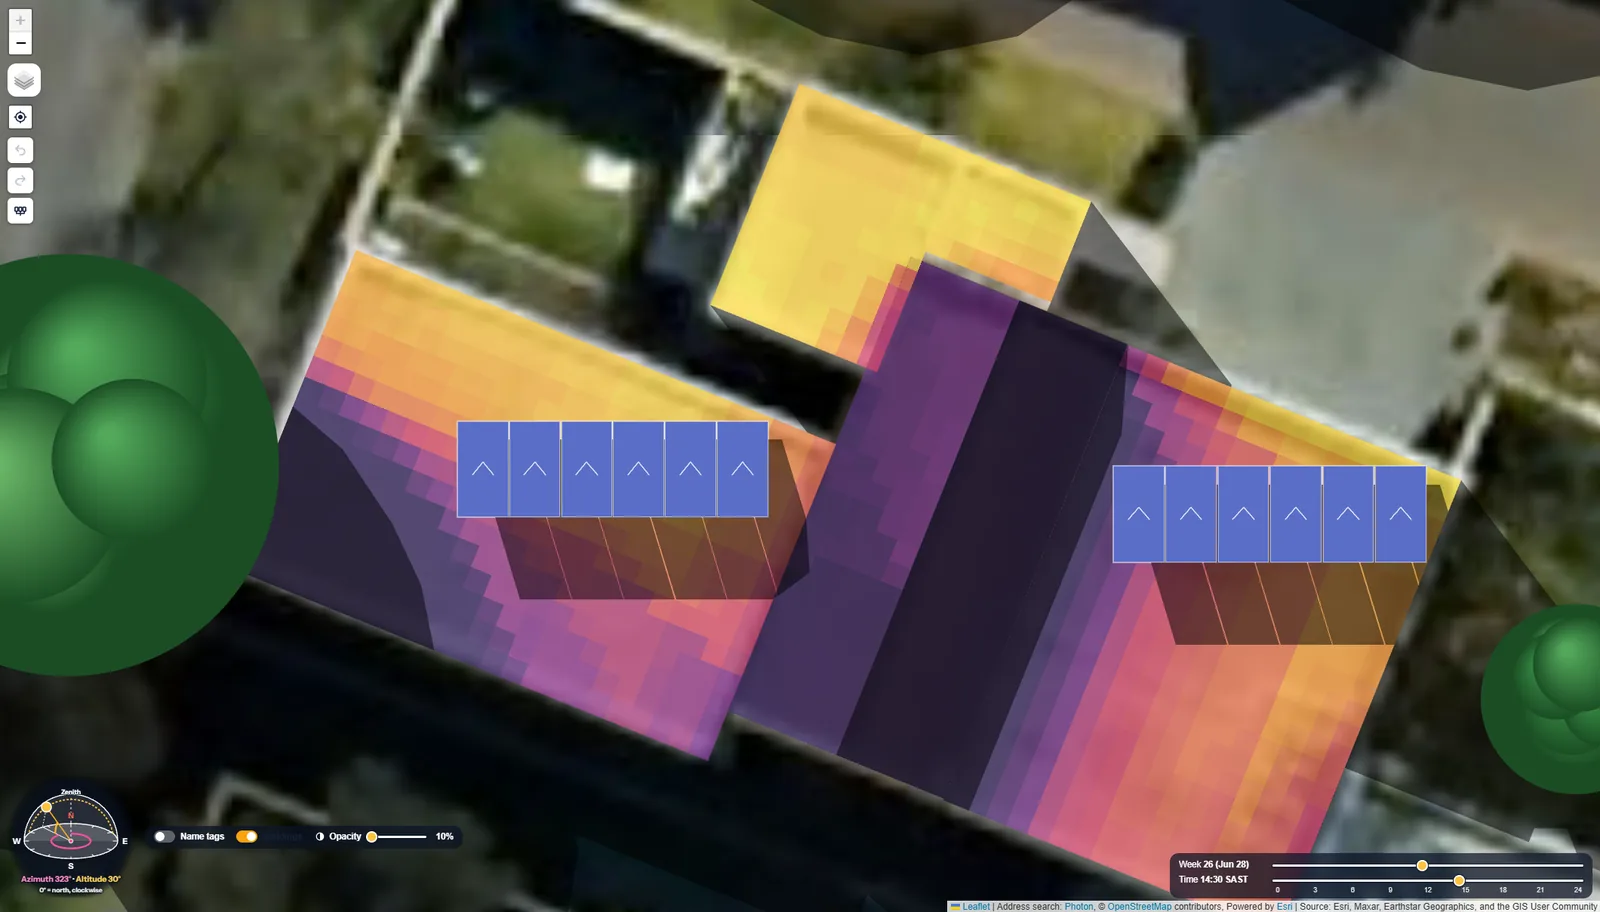
Most roofs aren't evenly sunny. A chimney throws a shadow across one corner every winter morning, the neighbour's double storey takes the late afternoon, and the back slope barely sees the sun from May to August. A heatmap of the roof shows all of that at once, so you can put the panels where they'll earn the most. The question is: the most when?
Explore the sample projectOpens the designer with a worked example and its heatmap. Free, no account needed.
What a roof heatmap shows
A roof sunlight heatmap colours every part of the roof by how much sunlight reaches it, in kWh per square metre. It's worked out on a grid (Lekker Sun uses 0.5 m) over a typical weather year for the site, and it includes the shading from everything around the roof: the house's own ridges and chimneys, trees, and the buildings next door. Direct sun is shaded, and so is the light from the rest of the sky.
It scores the bare roof, before any panels go on. That's the point. You're looking for the best spots first, then deciding where the arrays go.
The useful part is that you can look at it three ways: the whole year, winter only, and summer only. On a lot of roofs those three pictures don't agree.
Why winter and summer maps look so different
It's the height of the sun. Take Cape Town, at about 34° south. At midday in midwinter the sun is only about 33° above the horizon. In midsummer it's nearly overhead, at about 79°.
Now picture a 30° pitched roof, one face pointing north and the other south. At winter noon the sun hits the north face almost square on: the face gets about 89% of the light it would get with the sun straight in front of it. The south face gets about 4%. At summer noon, the north face gets 94% and the south face still gets a respectable 76%.
So the south face that looks fine on a summer heatmap is close to useless in June and July. Shadows tell the same story. A 10 m tree casts a shadow about 16 m long at winter noon and under 2 m at summer noon. A tree that never touches the roof in January can cover half of it in July.
(North of the equator, swap north and south, and winter is December to February.)



Strategy 1: place for the best year
Put the panels on the parts of the roof with the highest yearly total. This gets the most kilowatt-hours out of every panel you pay for, so it gives the best return per panel in most cases.
It works best when the client can use or get credit for summer surplus: when there's a decent export credit, or a battery big enough to soak up the midday excess. It's also the safe default when you don't know much about the client's usage yet.
The catch is winter. The best-year layout can still leave the client buying a lot from the grid in June, when the days are short and the load is often at its highest.
Strategy 2: place for winter
Here you use the winter heatmap to choose where the panels go, and often add a few more panels than the summer load needs. The aim is to cover more of the winter daytime load and charge the battery on short days. The price you pay is a summer surplus.
This pays off when:
- Winter is when electricity costs most. Some tariffs charge more in winter, and winter is when bills peak for homes with electric heating or long evenings.
- Winter is when the load is highest. Heaters, geysers working harder, lights on earlier.
- Backup matters. If the battery has to get through outages, it needs to fill on a short, low-sun day, not just in December.
On a flat roof or a ground mount you can also tilt steeper, which favours the low winter sun. On a pitched roof you're stuck with the pitch, so the heatmap mostly helps you pick the face and avoid the winter shadows.
Be straight with the client about one thing. No layout can promise zero grid use in winter. A run of grey days, a cold evening after sunset and a battery that's already empty will all send the house back to the grid. What winter-first placement does is shrink that winter import, and you can show by how much.
What happens to the summer surplus?
If you place and size for winter, summer will produce more than the house can use. Where that energy goes decides whether the extra panels were worth it:
- Export credit: the surplus earns something, even at a low rate, and the winter-first design costs little.
- Zero export: the surplus is simply lost. The inverter turns production down once the house and battery are full. You've paid for panels that sit idle on summer afternoons.
- Load shifting: pool pumps, geyser timers and washing machines moved to midday soak up a fair bit of it for free.
- Clipping: more panels on the same inverter also means more clipping on bright summer days. See the guide on DC/AC ratio and inverter clipping, and stay inside the inverter's maximum PV input power.
Side by side
| Best year | Winter first | |
|---|---|---|
| Panels go on | The highest yearly totals | The highest winter totals |
| Yearly energy per panel | Highest | A little lower |
| Winter grid use | Higher | Lower |
| Summer surplus | Smaller | Larger |
| Suits | Export credit, a large battery, an even load through the year | Winter-heavy load, winter tariffs, backup, some export credit or summer loads to shift |
| Watch out for | Big winter bills the client didn't expect | Lost surplus on zero export, extra clipping |
Often the answer is somewhere in between. Fill the spots that score well in both maps first, then decide whether the last few panels go on the summer-only spots or not at all.
Try it on the sample projectOpens the designer with a worked example and its heatmap. Free, no account needed.
Doing it in Lekker Sun
Set the location, draw the buildings and mark the ones the system is for as main (surrounding buildings stay grey and only cast shade), then save the project. Open the Roof heatmap tile on the Design page and press Make heatmap. Tick Include flat roofs if you want flat roofs scored at the best tilt for the site.
Switch between the whole year, winter and summer to see how the roof changes. The Highlight from slider sets how much of the best spot counts as good: at 80%, everything below 80% of the sunniest spot turns purple, so the usable area stands out. The heatmap doesn't include shading from your own panels, so check rows on a flat roof in the simulation.
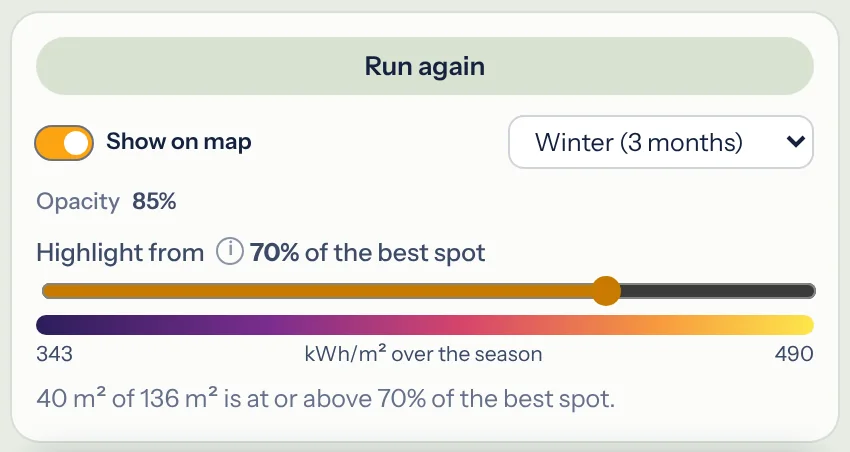
Draw the arrays, simulate the year, then open the Finance page. The typical winter week shows the grid import day by day, and with zero export you'll see the lost summer solar dotted on the charts. Try both layouts and compare. The Results tab shows all three heatmaps with the sunniest spot marked, and a table of the roof area at or above your threshold, so it's clear why the panels are where they are.
Running a heatmap on your own project comes with Pro and Business, or with a bought project. The sample project opens with its heatmap already made, so you can try the season switch and the slider for free.
See the heatmap on a real design
The sample project opens in the designer with its heatmap ready. Free, in your browser, no account needed.
This guide is general information to help you plan and compare options. It is not engineering, electrical or financial advice. Always follow the equipment manufacturer's instructions and your local wiring rules, and have a qualified installer check the design.