 Lekker Sun
Chapter 7 of 12
Consumption, simulation and battery size
This chapter puts the design to work: how much the system produces hour by hour over a typical year, how much of that the household actually uses with zero export, and how big the battery needs to be.
All chapters
Enter the consumption
On the Finance tab, type the Monthly use in kWh, from the electricity bills. If the months differ, click Enter each month and fill in all twelve. Our example uses 550 kWh every month, 6,600 kWh a year.
If winter bills are clearly higher, use the real monthly figures. A winter-first design is only as good as the winter consumption you give it.
Choose the daily usage pattern
Monthly totals don't say when in the day the power is used, and with zero export that matters a lot: solar can only be used as it's made, or stored. Pick the pattern closest to the household:
- Water heater + evening peak (typical home)
- Evening peak (out at work)
- Daytime (home all day)
- Small business (8:00–17:00)
- Flat
The chart beside it shows the average daily shape. Our example uses the typical home, with peaks in the early morning and evening.
Import a load profile from meter data
If there's a smart meter or a logger, click Import meter data (CSV) to use the real data instead of a pattern. Download Template 1 (a typical day for each month) or Template 2 (meter intervals) to see the layout, choose whether the values are kWh per interval or average kW, and pick the file. The guide to smart-meter data and load profiles covers the common traps.
Tariff and economics
- Each part folds away: click a heading (Monthly electricity consumption, Tariff, Blocks, Fixed charges, Simulation assumptions) to open or close it. A closed part shows a one-line summary.
- Provider tariff (Pro and Business): pick your electricity provider's tariff (Eskom direct, City Power, City of Cape Town or Tshwane) and its rates, fixed charges and VAT are filled in for you. Check them against the provider's tariff page (the link appears under the list) and change anything that differs; once you change a rate it shows as Custom, based on that tariff. The project keeps the rates it was given, even when the provider's rates change later. On other plans, or for another provider, type the rates yourself.
- Price per kWh: One price, or Blocks when the price goes up in steps with the month's use (for example up to 600 kWh, then above 600 kWh). Solar saves from the most expensive block first. Then the price's yearly increase.
- Export credit R/kWh: what the municipality pays for exported energy. Leave it at 0 for zero export.
- VAT %: type the prices and fixed charges without VAT, as the statement shows them, and the VAT is added (15%). Set it to 0 if the prices you type already include VAT.
- Fixed charges per month, one line for each on the bill (for example the service charge and the network charge). They stay the same with solar.
- Simulation assumptions (its own fold under Tariff): maintenance per year, the discount rate used for the NPV figure, and the optional sunlight override. Savings are always worked out over 10 years, fixed charges rise with the tariff's yearly increase, and panels are taken to lose 0.5% of their output a year.
- Battery: usable depth of discharge and round-trip efficiency, from the battery's datasheet.
Once the savings are worked out, Electricity bill for shows one month laid out like a statement, without and with solar: each block's kWh and price, the fixed charges, VAT and the total. Pick the month from the list to compare it with a real bill. The tariff rates themselves stay on the Finance page: the report shows the costs and savings worked out from them.
Set zero export
Set Export surplus solar to No, zero export. Then solar that the house and the battery can't use is switched off by the inverter and lost, as it is with a real zero-export setting. The charts show that lost solar as a dotted line, and the report lists it month by month.
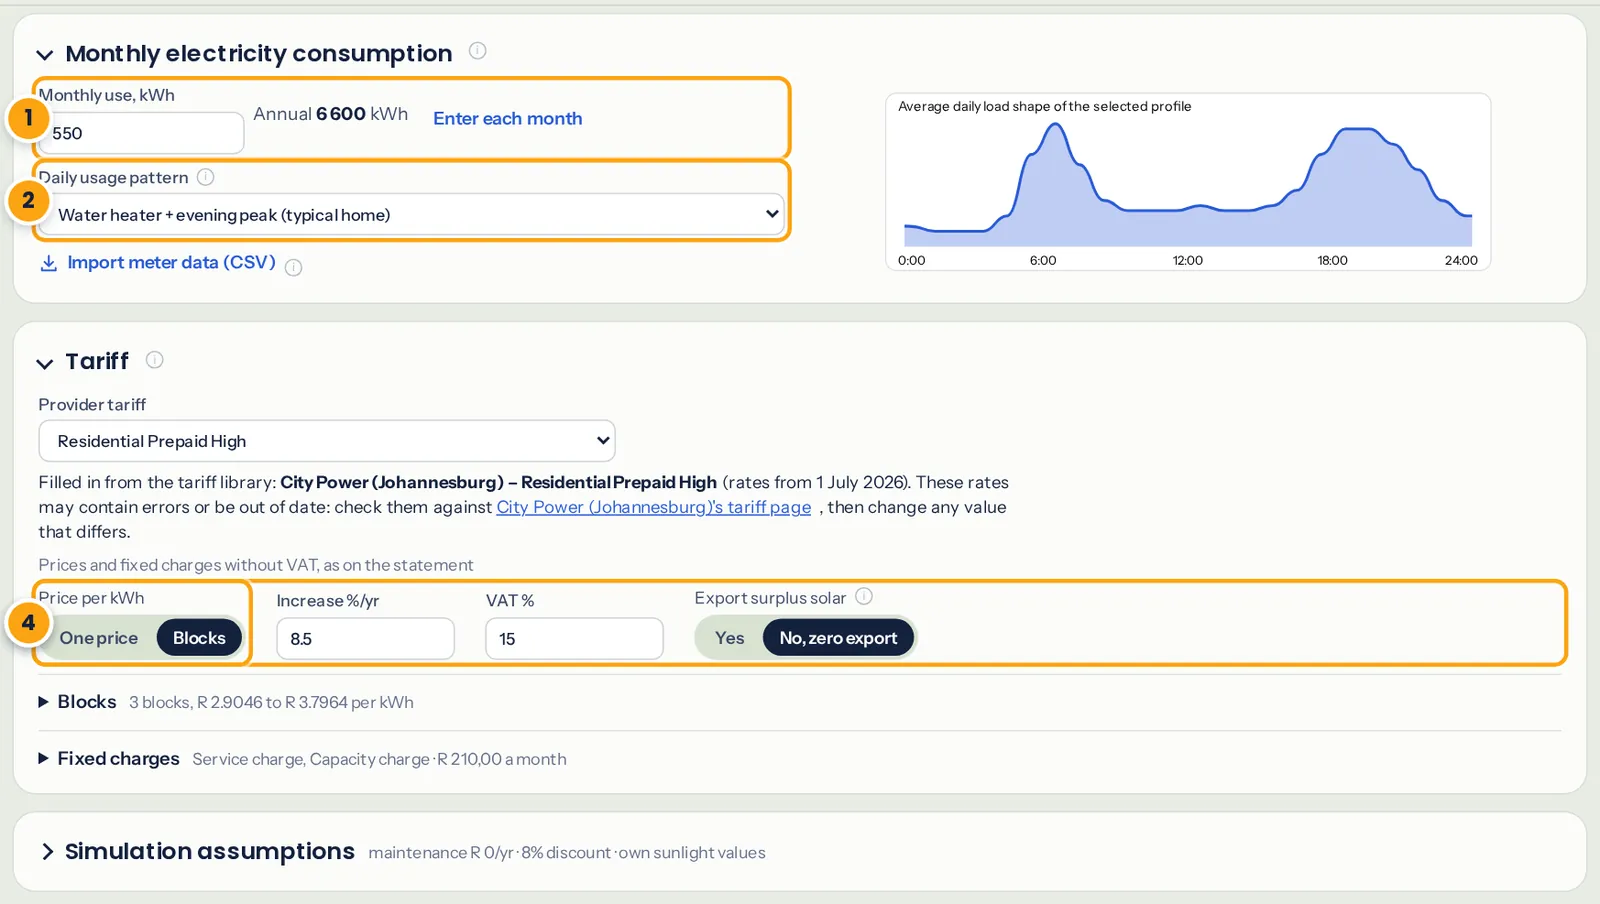
- Monthly use, or Enter each month.
- Daily usage pattern, or import meter data.
- Price and yearly increase; fixed charges, years and the rest under Assumptions.
- No, zero export.
Simulate the year
On the Design tab, click Simulate year in the Simulation card. Lekker Sun runs every hour of a typical weather year for the site, with the shading from your model on each array, the panels' temperature and the inverter's limits. The card shows yearly production, kWh per kWp and the shading loss; Details opens the rest:
- Production per month as a bar chart (beside the shading grid on a wide screen), with the highest and lowest months marked. A dashed outline above a bar shows what that month would give without shading, and the dashed line across is the monthly average.
- The shading grid for each MPPT input (see below).
- The other losses for the year (panel heat, inverter clipping and, where your plan includes it and the project is saved, the distant horizon) and, with more than one array, each array's share of the production.
The weather is fetched for the site automatically. On the Finance tab you can override the monthly irradiation with your own values, but you rarely need to.
Read the shading grid
Click Details under the Simulation figures. For each MPPT input, the shading grid shows the average shading in every hour of every month: green is clear, red is heavily shaded. It's the quickest way to see when and where shade costs you.
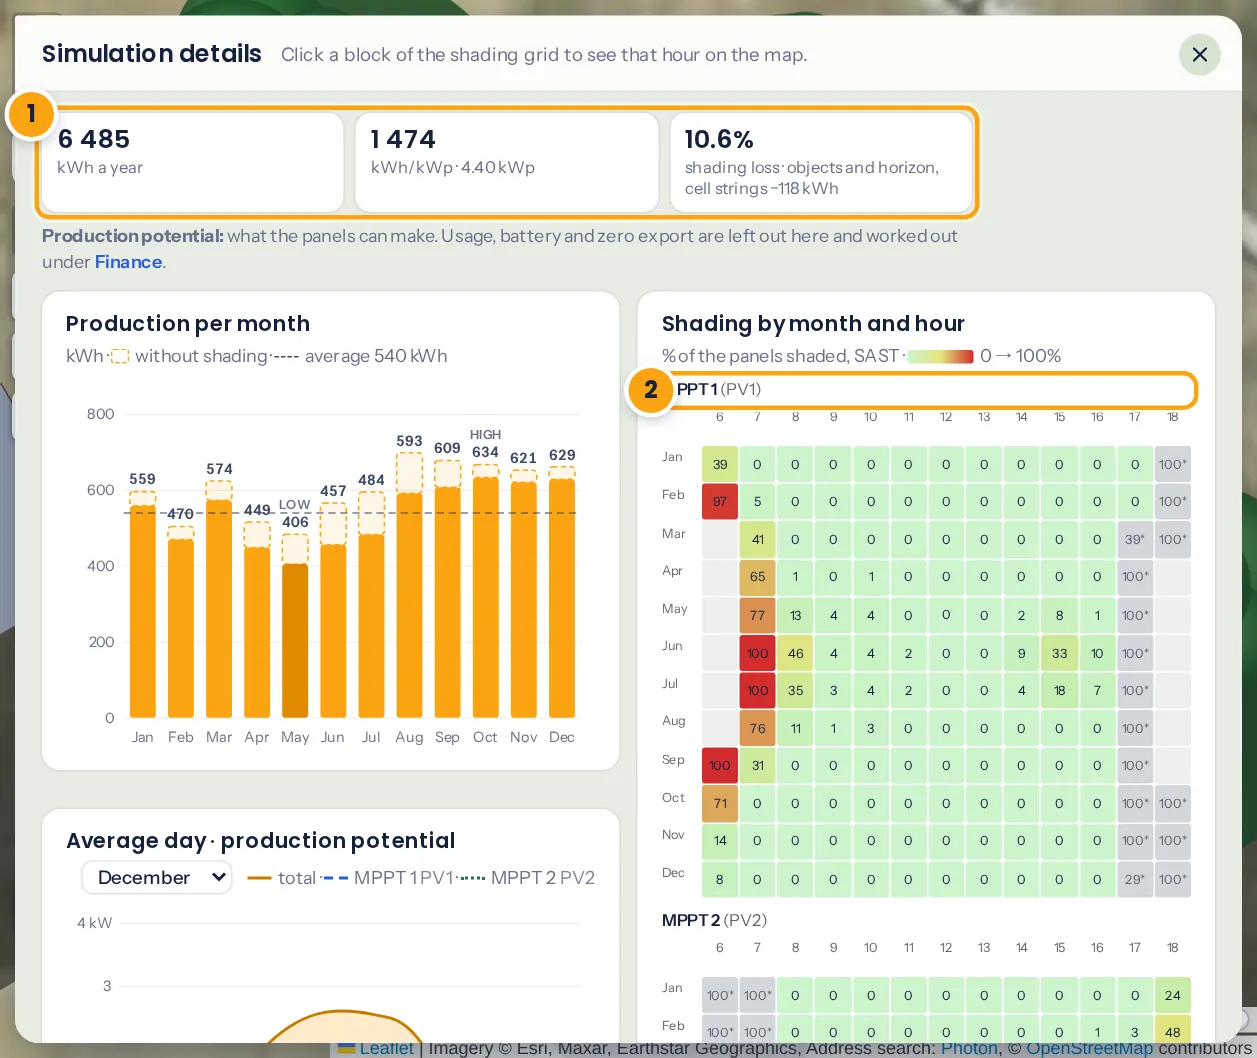
- Yearly production and kWh per kWp.
- The shading grid for one MPPT input: months down, hours across.
- Click a block to close the details and jump the map to that month's worst week at that hour, and see what's causing the shade.
- A grey block with a * means the sun is behind the panels at that time (for example a north-east array late on a summer afternoon). That's down to the direction the array faces, not shade.
- For a winter-first design, look at the May to August rows. Red in the middle of the day means the array is in the wrong place: go back to the winter heatmap and move it.
In our example, array 1 (below the chimney) is mostly clear from 8:00 to 16:00 right through winter, with only light shade in the mid-afternoon. Array 2 on the back wing loses its sun from about 15:00 between April and August: that's the big tree to the north-west. There's no better roof for it, so the choices are to accept it, or to prune the tree. Hide the tree with 👁 and simulate again to see what it would gain.
Calculate the savings
Back on the Finance tab, click Calculate savings. After that the results update by themselves whenever you change an input, here or on another tab. Recalculate beside the results works them out again straight away. Lekker Sun works through the typical year, charging the battery from surplus solar and running the house from it in the evening, within the battery's and the inverter's limits. You'll see:
- Self-sufficiency: how much of the consumption solar and the battery cover.
- Solar self-consumed and, with zero export, solar lost.
- Grid import over the year, and the month's electricity bill without and with solar.
- Year-one saving, payback, net gain, ROI, IRR and NPV.
These are the results at a glance, below the inputs. The month-by-month energy balance, the typical summer and winter weeks and the year-by-year savings are on the Results tab (Full results).
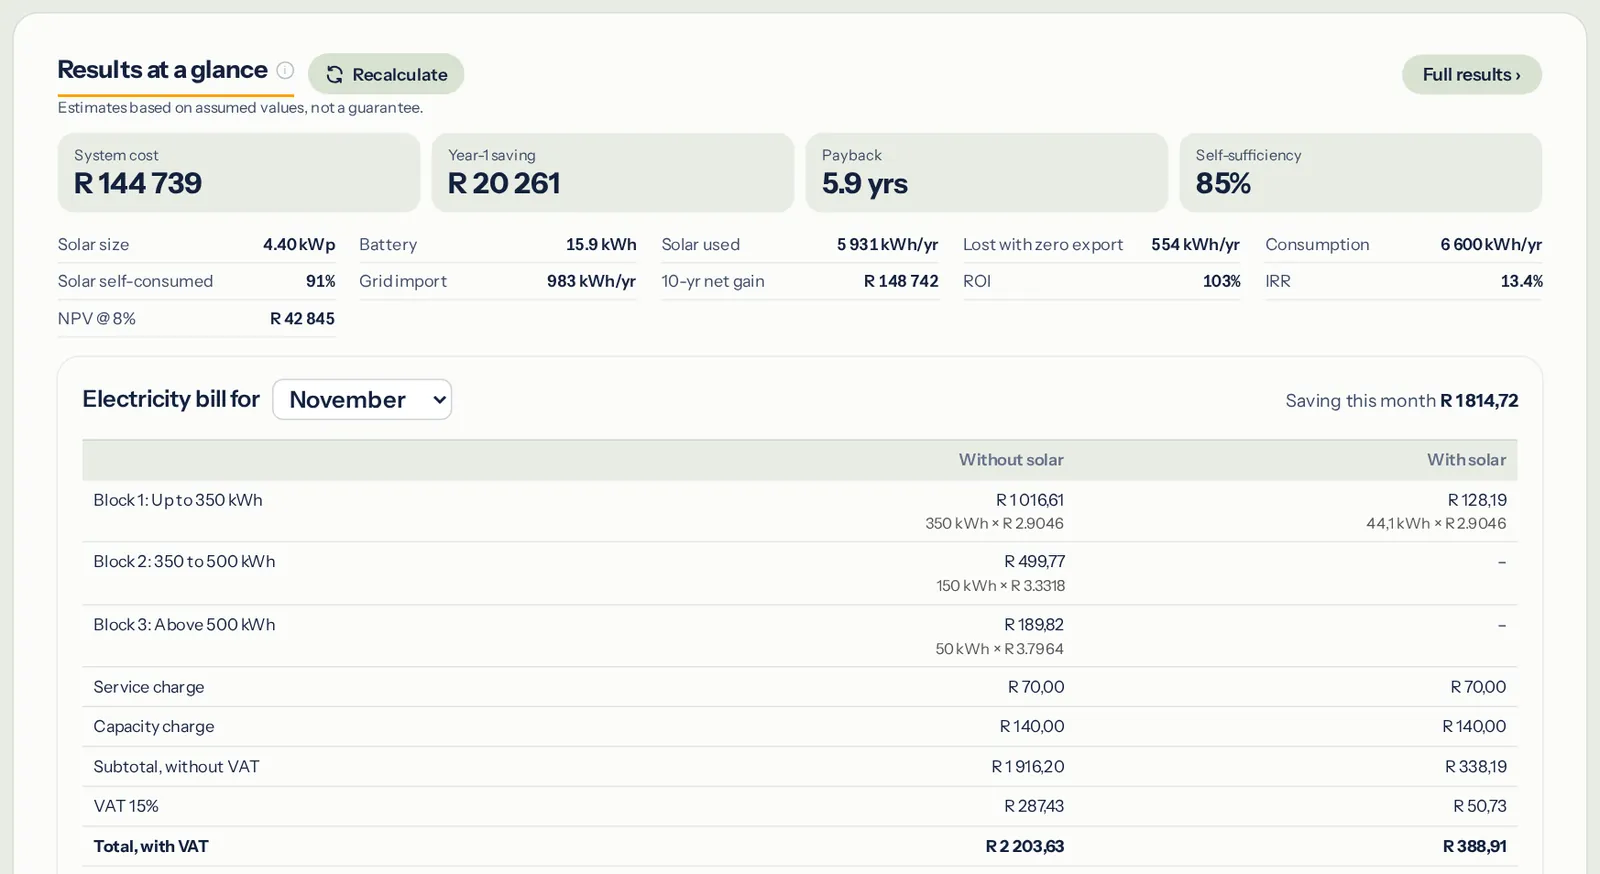
In our example the 4.4 kWp of panels and 15.9 kWh battery cover 95% of the household's 6,600 kWh. Grid import is about 330 kWh a year, mostly in winter, and about 460 kWh of summer solar is lost to zero export. Payback is just under five years. The payback, NPV and IRR guide explains the money figures.
Size the battery from the results
The battery is right-sized when adding more stops making a real difference. To find that point:
- Note the self-sufficiency, grid import and payback with the battery you have.
- On the Equipment tab, change Strings in parallel under the battery bank (or the battery's quantity in the bill of materials) by one battery.
- Open the Finance tab again: the results update by themselves. Compare.
Things to look for:
- Winter grid import that stays high in the evenings means the battery runs flat. More battery helps only if there's solar surplus to fill it on a winter day.
- Lost solar in summer with zero export means the battery is full by midday. A bigger battery soaks some of it up, but it's often cheaper to accept the loss.
- Payback usually gets longer with each extra battery once self-sufficiency is above about 80 to 90%. Compare both: the one that pays back fastest, and the one that keeps the house off the grid the most.
More background in how to size a home battery from the load profile.
Planned: battery optimisation. Lekker Sun will work out from the load profile and the simulation how many kWh of battery the client needs to be self-sufficient, so you can show the step up as an option on the proposal.